


Finally we have visibility over how often our content features in Google’s generative AI features. Now we can see exactly how many clicks we’ve lost to…
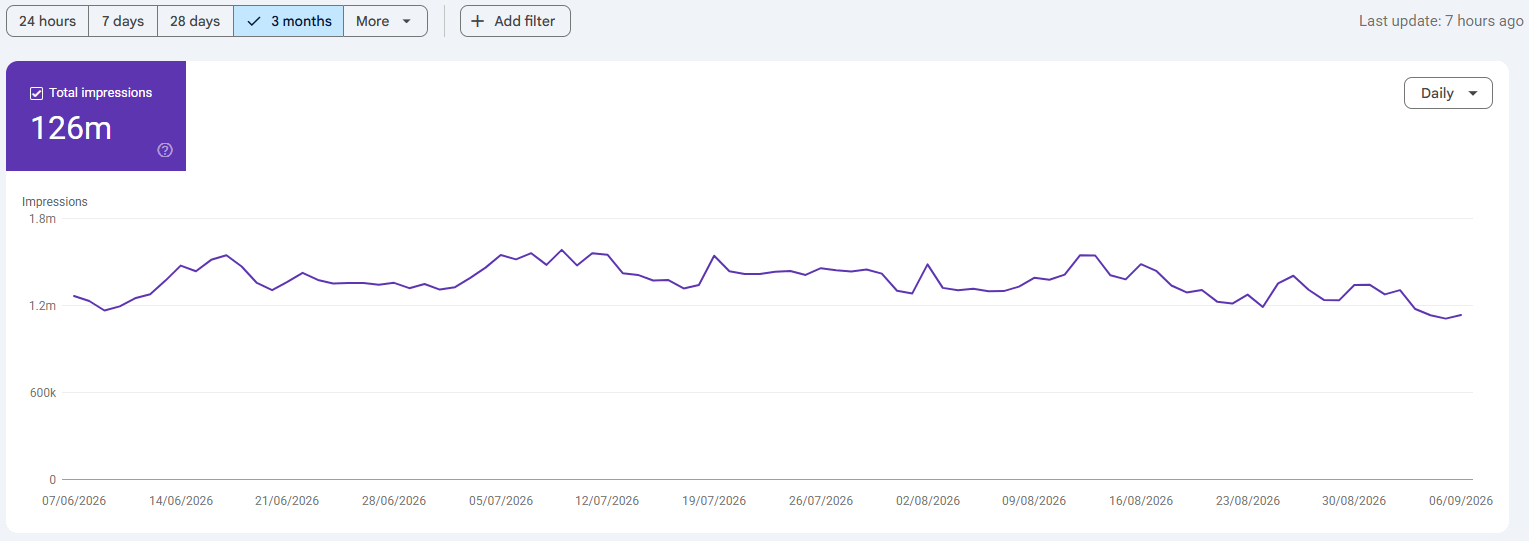
Hello, sorry is that Sundar? I think the Generative AI report is broken - I can’t see the click data. You what? You meant it to look like that?
Oh. Is that because AI features don’t send any cli… No, that’s just a coincidence you say.
OK, well do we at least get to see any query-level…
Nothing?
Given this has taken up the best part of two years of our working life, I’d have liked something a little more concrete to show to clients, friends and my long-suffering wife. I can’t have scintillating dinner conversation without click-level, generative AI data.
Something must be done - and I think I have a solution.
I consult on all things SEO, AI search, Google Discover and wider discoverability for publishers and media companies. Drop me a message via Tomorrow Consulting or on Linkedin.
TL;DR
Google’s Generative AI Report gives you visibility. That’s it
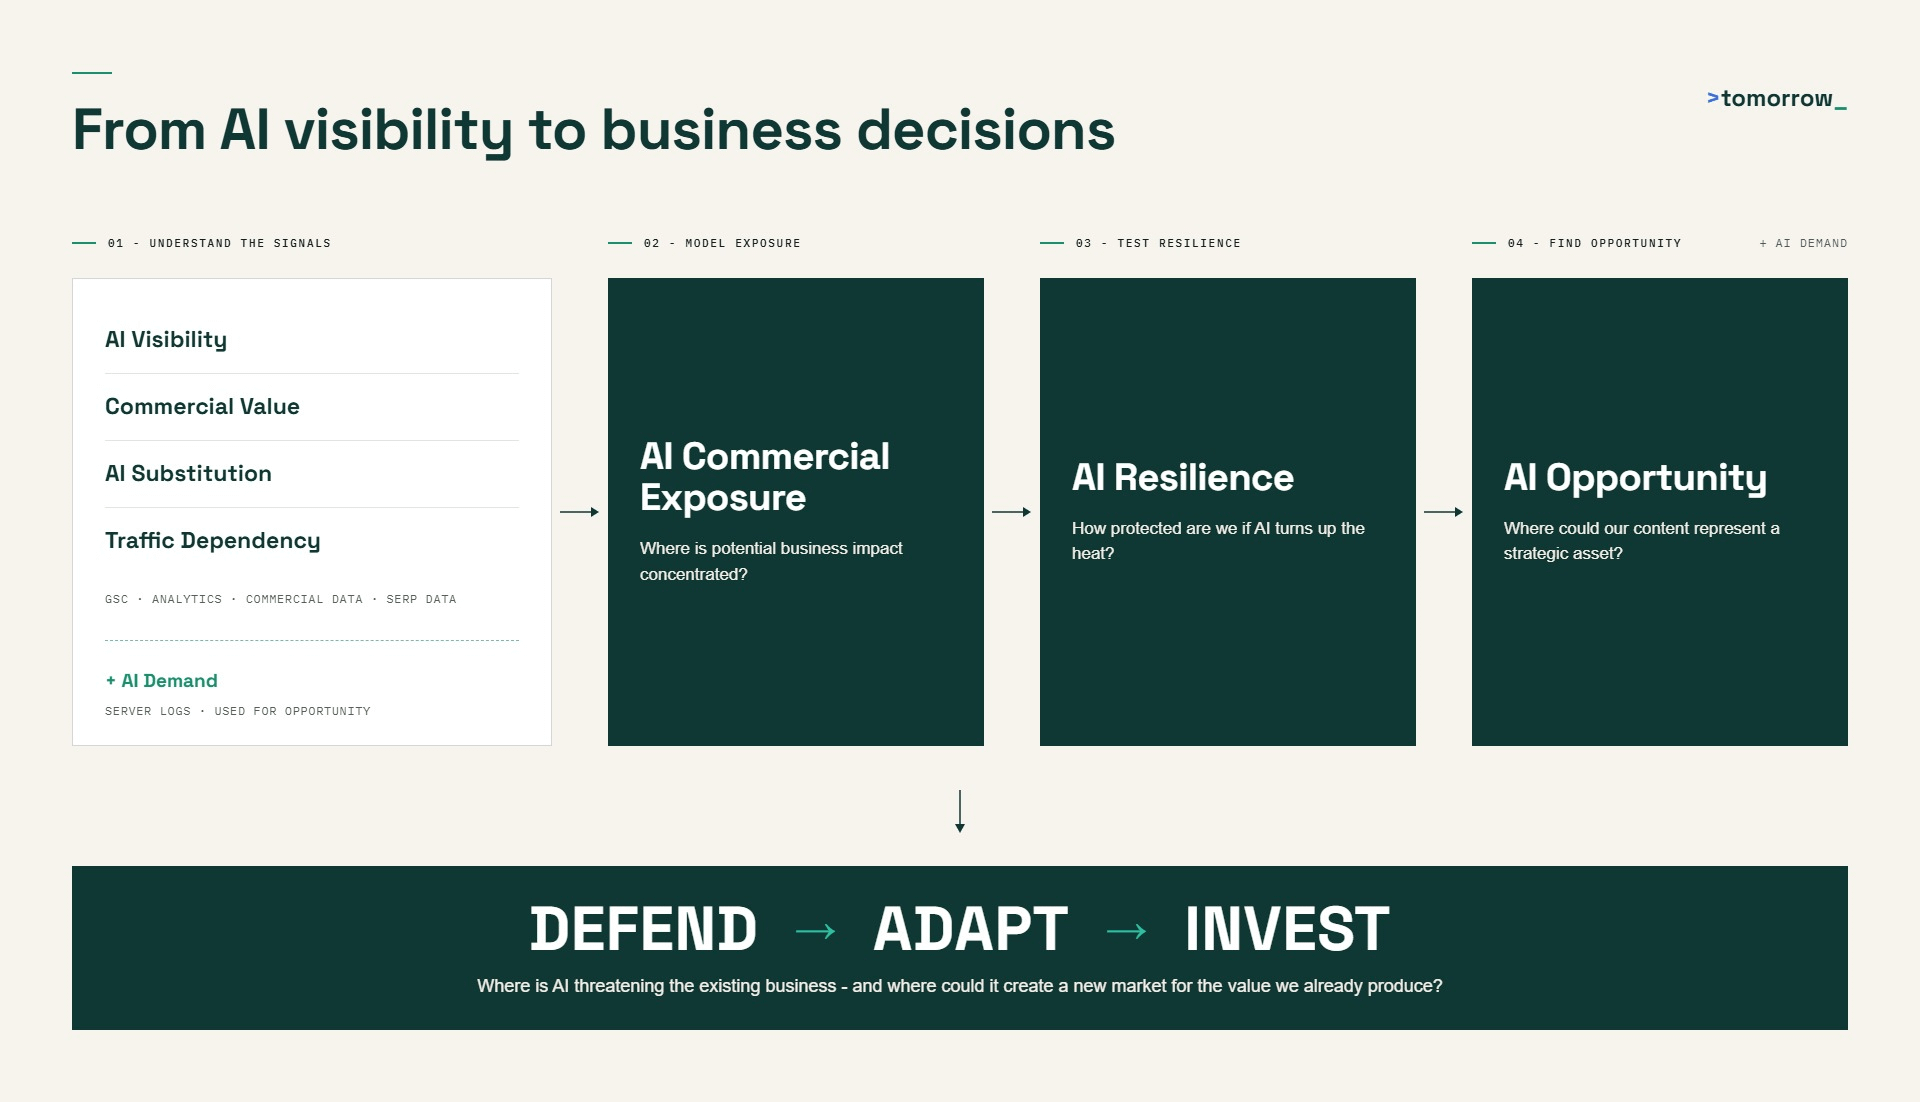
But add commercial data and traffic dependency and you can calculate exposure
Which doesn’t equal risk. But it’s close. Branded search, direct and returning audiences, and content defensibility can get you even closer
AI can be an opportunity. The licensing market is simmering. Server logs reveal bot access by crawler type. They help you identify where to invest
Partnership post
If you’re interested in bot access, server logs and analytics data, I would highly recommend looking into the team at Publytics, particularly their new server-side bot analytics tool Honeylog.
Fantastic value, a brilliant product for publishers in this era looking to truly understand on-site bot behaviour and lovely to work with!
Let’s start with the problem
Technically we have generative AI data in search. First-party visibility data should be a huge deal. But there are limitations.
Impressions, impressions everywhere, but not a drop to drink.
If you’re unfamiliar with how an impression is counted, it’s worth a quick wander down John Mueller trail:
“The impressions are based on links to your site being shown in AI Overviews / AI Mode. I don’t know if just a favicon would be linked, but if it’s linked to a page on your site, that would count… a link shown directly can count, while a link that requires activation only counts after that activation.”
Directly shown links can count without expansion; links requiring activation count after activation. Not that helpful really.
However… I don’t think the report is useless. At all. I think it’s almost useful. It provides first party visibility data in arguably the most used AI interface in the world.
So what does it show?
Visibility. Not exposure, risk or value.
At least not directly. Click data would take us halfway there. But to understand your true exposure, you would need to understand how your traffic and commercial value is intercepted by said AI system(s).
So, as ever, we need to layer data together.
For the core model, you’ll need access to:
Search Console’s Generative AI report
GA4 - or your analytics platform of choice
Commercial-level data (revenue, conversions - you choose)
And if you want to go further:
AI Overview prevalence across your important queries
Server logs showing AI crawler activity
Server logs give us a proxy for demand but they are an optional extra. You can still get some superb insights with GSC and audience and commercial data from GA4.
Fortunately for you, I’ve built a diagnostic in Google Sheets to help you turn Google’s Generative AI data into something you can actually make decisions with. See step 6 - paid subscribers only!
Here’s how I think we can approach it
A step-by-step guide to working out your resilience and exposure using Google’s intentionally half-baked reporting. As ever, you can listen to a short overview of this, with a sneak peak of the workbook here:
Step 1: Get the data out of the GSC aggregate
Take the total sitewide AI impressions from the Generative AI report, then export the page-level data. Worth noting that the Pages export doesn’t necessarily represent every page or impression because of the thousand-row limit.
That matters because we’re going to classify those URLs and analyse visibility by content area. To start with, subfolder is more than fine:
/news/
/sport/
/business/
/lifestyle/
If you’re smart and you understand how to get more out of Search Console, then you can export the report at a subfolder level and combine data from each property. For smaller sites, this shouldn’t represent much of a problem.
Step 2: Understand AI visibility concentration
The page-level export lets us compare different content areas and answer a few useful questions. Is most of our AI exposure coming from News, Sport or Business? Is that visibility spread across lots of URLs, or concentrated among a handful of ‘performant’ pages?
This means we can establish:
Share: Where is attributable AI visibility concentrated?
Representation: Which sections and URLs appear in the dataset?
Intensity: Is that visibility evenly distributed or concentrated among a handful of URLs?
Coverage: How much of Google’s total reported visibility is represented in our page-level dataset?
You can still get the trend of AI impressions - up or down over time - directly from GSC.
We also need to understand how much of Google’s reported AI visibility our page-level dataset actually represents. If you go over the 1,000 row limit, you are seeing a sample.
Step 3: Include Commercial data
Now we know where AI visibility is concentrated. But how much does that actually matter to the business? Have we reached the final boss of AI buggery, or has the robotic sodomy just begun?
Keep this simple.
Pick one primary commercial KPI - revenue, subscriptions, conversions, leads etc. - and use the same KPI across every subfolder. The metric doesn’t really matter, provided it represents business value and you use it consistently.
You can layer in secondary commercial metrics - registrations, propensity to subscribe, advertising yield or whatever else matters to your business - as supporting context. But our primary measure of Commercial Value should remain consistent.
Please don’t overcomplicate this. Believe me. My locks might be lustrous, but after 10+ rewrites they are greyer than when I started.
Now we can start comparing visibility against commercial value.
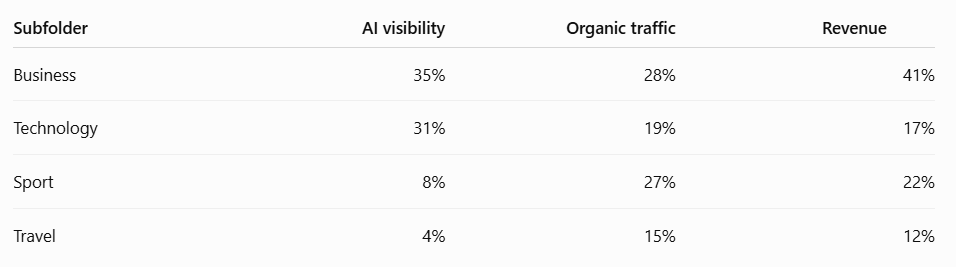
Here, Business has high AI visibility, but higher revenue. Technology has comparable AI visibility, but significantly less revenue. Sport has very low visibility, but a larger portion of revenue.
This is a much more rigorous assessment.
Step 4: Understand AI Substitution
For this, you’ll need some third-party SERP data. DataForSEO is great. Other scraping tools are available, per BBC guidelines.
If you already have a representative keyword universe for each subfolder, use that. If not, the top 100 or 1,000 GSC queries per site or section is a perfectly reasonable place to start.
For each query, establish whether it triggers an AI Overview or other AI-mediated search experience. This doesn’t tell us that AI actually substituted a click. You’d need some kind of user testing panel for that and I’m not your guy for that level of rigour.
It just tells us exposure in the current search landscape.
You don’t need this data. Substitution is an enhancement, not a requirement. If you have it, great. If you don’t, you can still calculate Commercial Exposure.
Step 5: Server logs baby
AI crawler activity.
If you’re new to the game, server logs are fantastic. They give away detail you cannot get anywhere else. They look a little scary and technically, you don’t need them for this. But they add a layer of uniqueness and granularity you cannot replicate.
What we want to understand is:
AI crawler access
Crawling frequency
Which sections and URLs they’re accessing
What type of AI crawler is making the request
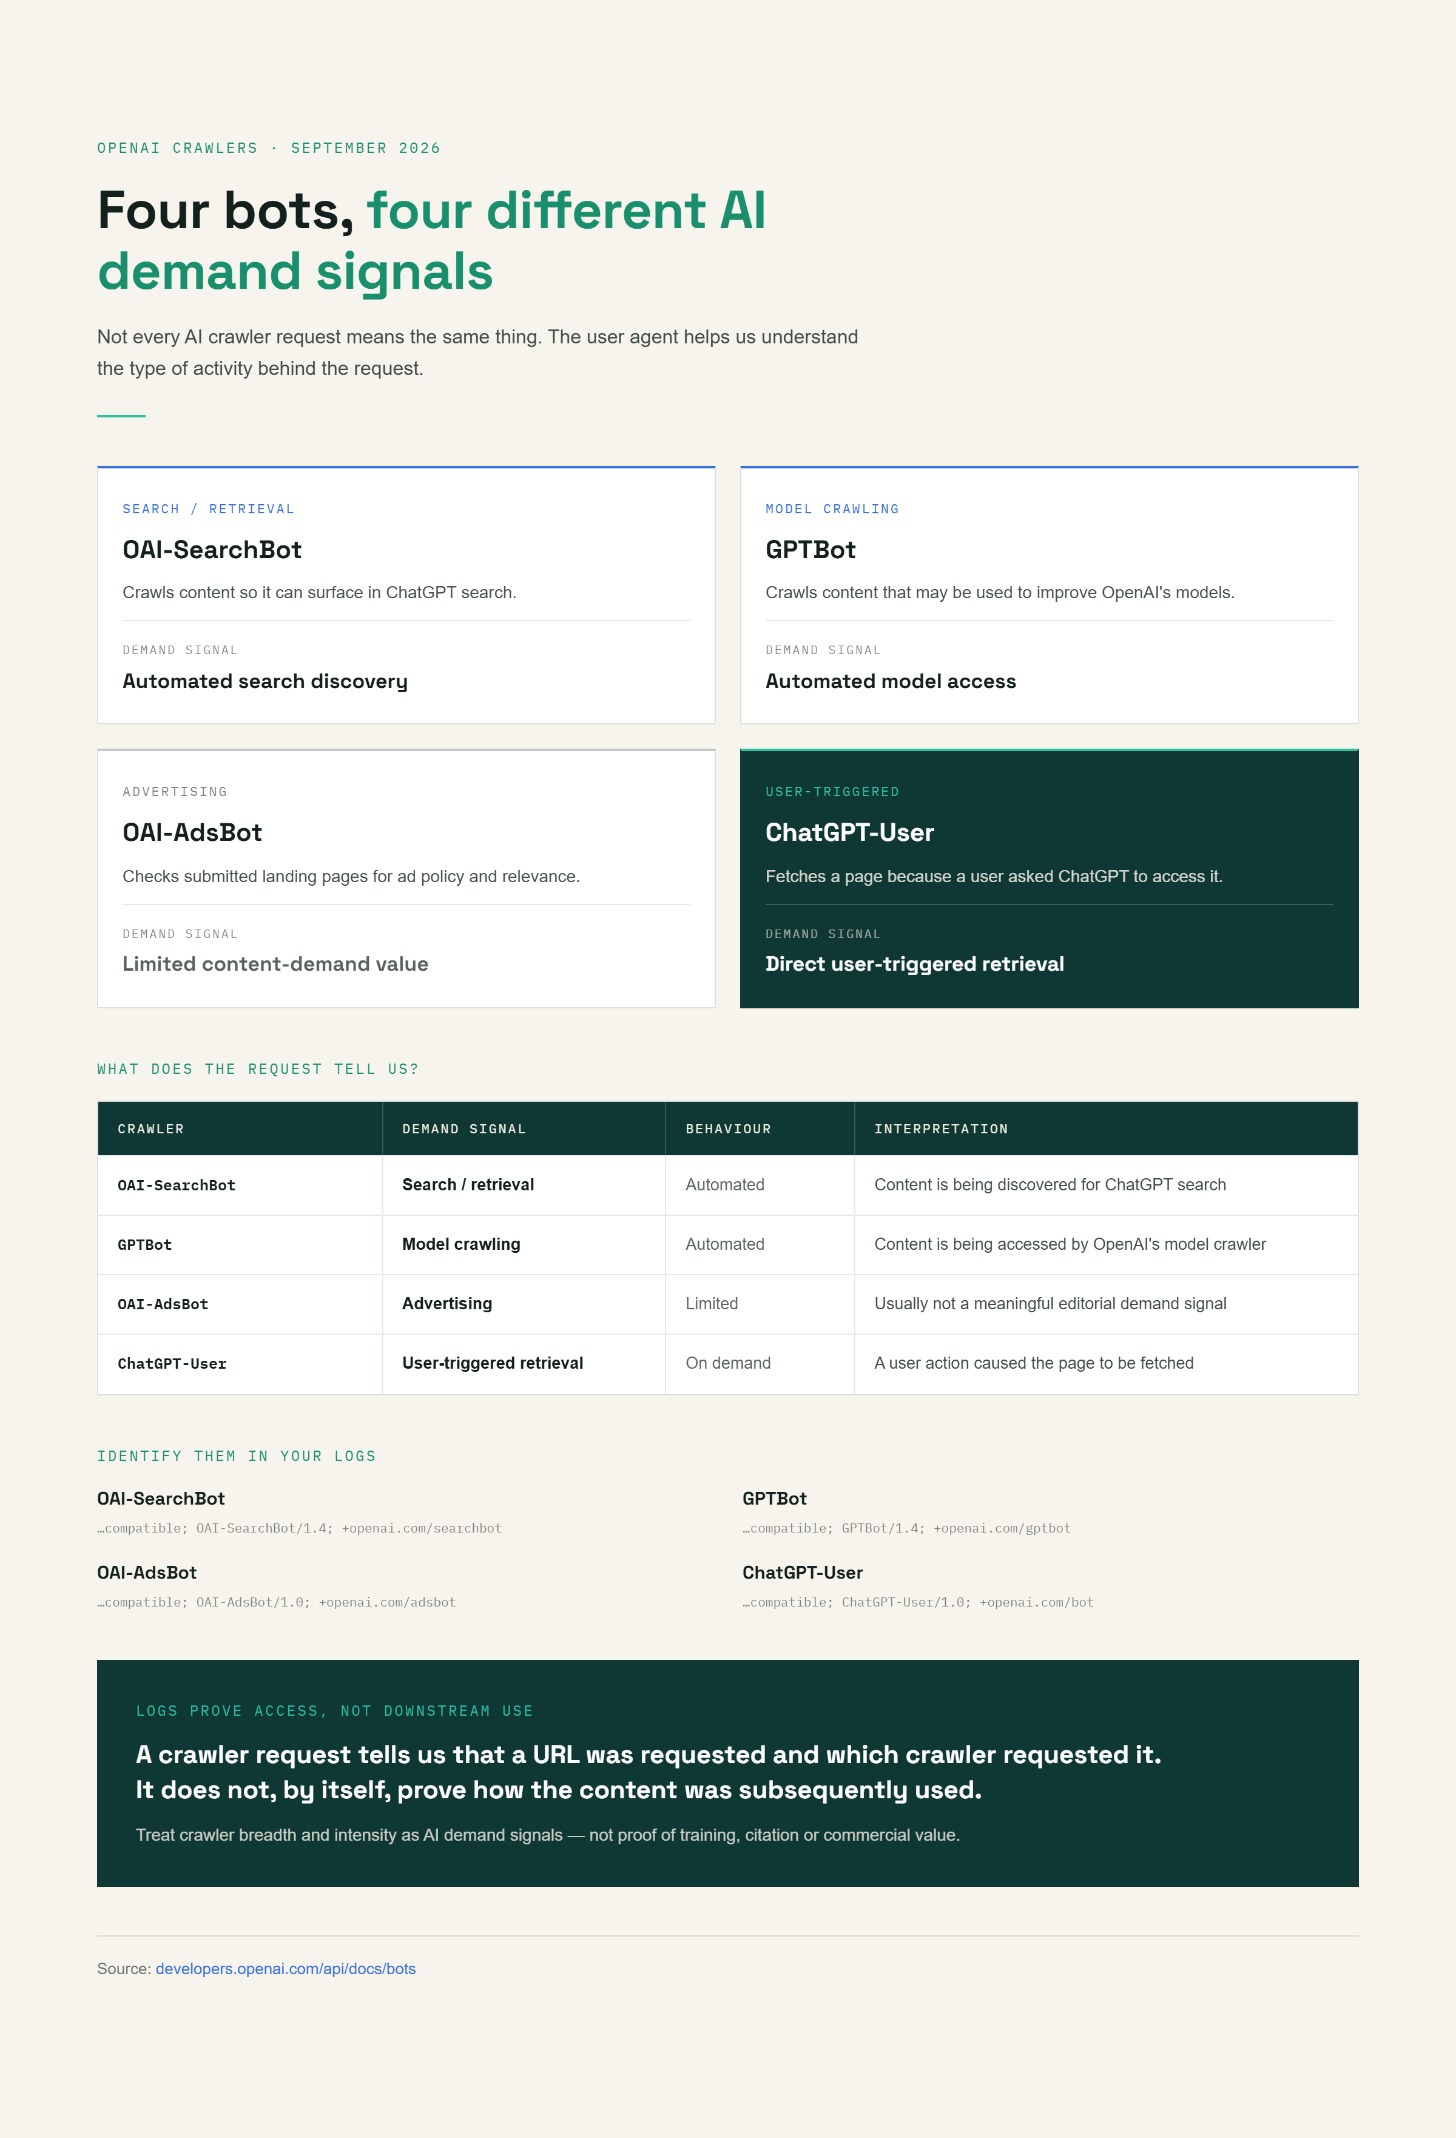
That last bit is increasingly important. Different crawlers are doing different jobs, so rather than lumping everything together as ‘AI traffic’, we can separate activity into training bots, search bots and retrieval bots.
That gives us a kind of AI demand signal: what is being access, where and - to an extent - why?
Gone are the days where we only care about Googlebot. Which I will say, is almost exciting.
One caveat: server logs only prove access. A training bot requesting a URL doesn’t prove that content was used to train a model. So we can’t directly prove usage. But we can say:
“This content is attracting AI crawler activity consistent with training, search and/or retrieval access.”
If you’re using the workbook and want to include server logs (optional), you’re still going to need to run the server log analysis prior to input. You’d need to aggregate by subfolder and bot type.
If you paste a 700MB Apache log into Google Sheets, don’t blame me because something breaks.
Step 6: Creating the commercial exposure model
There’s one final input we need: Traffic Dependency.
How dependent is each section is on organic search?
A site or subfolder with just 10% of its traffic coming from Google is lower risk than one with 90%. Particularly if the majority of the traffic is direct or branded.
Now we can bring these four inputs together:
AI visibility (V): Where AI visibility is concentrated across the site.
AI substitution (S) - optional: AIO saturation at a query level.
Traffic dependency (T): How dependent that content or business area is on organic search. Basically the proportion of total sessions coming from Organic Search.
Commercial value (C): How much of the site's actual business value is generated by that content or business area.
In the workbook, I have normalised these values to a 0-100 scale for simplicity. I really suggest you do the same, otherwise the numbers look insane.
AI Commercial Exposure = (V × S × T × C)^(1/4)
Huge AI visibility shouldn’t produce a huge exposure score if the content has almost no commercial value. Equally, something incredibly valuable isn’t automatically high risk if it has little AI visibility or limited search dependence. Unless you’ve fucked it up somewhere.
And remember: Substitution is optional.
If you don’t have reliable AI Overview data, don’t enter a zero. Zero means you measured substitution and found none. Just leave it blank and use the Core model:
Core AI Commercial Exposure = (V × T × C)^(1/3)
That gives us a single AI Commercial Exposure score from 0–100, showing where business impact is likely concentrated. Something third graders can understand.
The Google Sheets Diagnostic
Instead of farting about trying to do this manually, you can use this diagnostic to calculate your current visibility, risk and exposure.
The workbook includes:
AI Visibility analysis by subfolder
Core and Enhanced Commercial Exposure models (enhanced includes AIO data and requires a little server log analysis)
AI Resilience scoring
Optional AI Opportunity analysis using server logs
A final scorecard comparing your content areas
Of course if you subscribe and you either a) need some help or b) have a suggestion, just let me know.
Step 7: Measuring resilience
Now we have commercial exposure. But we need to know how vulnerable we are if AI turns up the heat? Or when it turns up the heat, is probably more accurate.
For example, let’s say you’re a company that focuses on live sports and statistics. Google’s latest Live NFL Game Feed might send a shiver down your spine.
Two sections could have exactly the same level of commercial exposure but face very different levels of risk. If AI does indeed try to kill us all, you’ll want to know how well protected each subfolder or business unit is before you pass.
One with a strong direct audience, loyal users and difficult to replicate content is in a very different position to one dependent on organic traffic.
To measure that, we’re going to look at four things:
Branded search: How much organic search demand is specifically for your brand.
Direct audience: How much traffic comes directly to you rather than through an intermediary.
Returning audience: How much of your audience keeps coming back.
Content defensibility: How difficult your content is to replicate or substitute, based on uniqueness, effort, expertise, proprietary information and access.
The first three can be expressed as percentages. Content defensibility requires some actual judgement on your part, so we’ll score that from 0–100 using a consistent, qualitative framework.
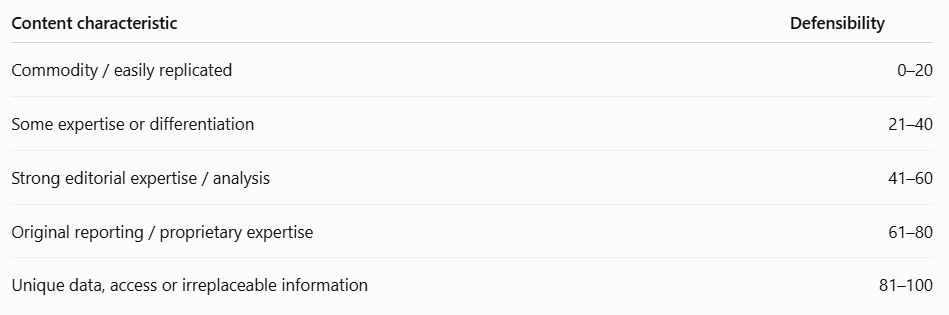
Combine this audience data and qualitative content review into a single score.
AI Resilience = (Branded Search + Direct Audience + Returning Audience + Content Defensibility) ÷ 4
The higher the score, the better protected that section is against further search substitution or intermediation by AI.
Step 8: AI opportunity
AI’s getting a hard rep.
Sure, it’s decimating reading ages and people’s critical abilities to the point where they can’t tie their shoes. But who needs critical functions when you’ve got a phone and a $20 subscription to Claude Code?
And who knows, there might be some kind of financial opportunity on the horizon. One you can now take advantage of.
By mapping our server-log data to individual pages and subfolders, we can compare AI demand with our own assessment of content value.
Frequency: How often AI systems access our content?
Breadth: How widely they access it?
And alongside that:
Purpose: What types of crawlers are responsible?
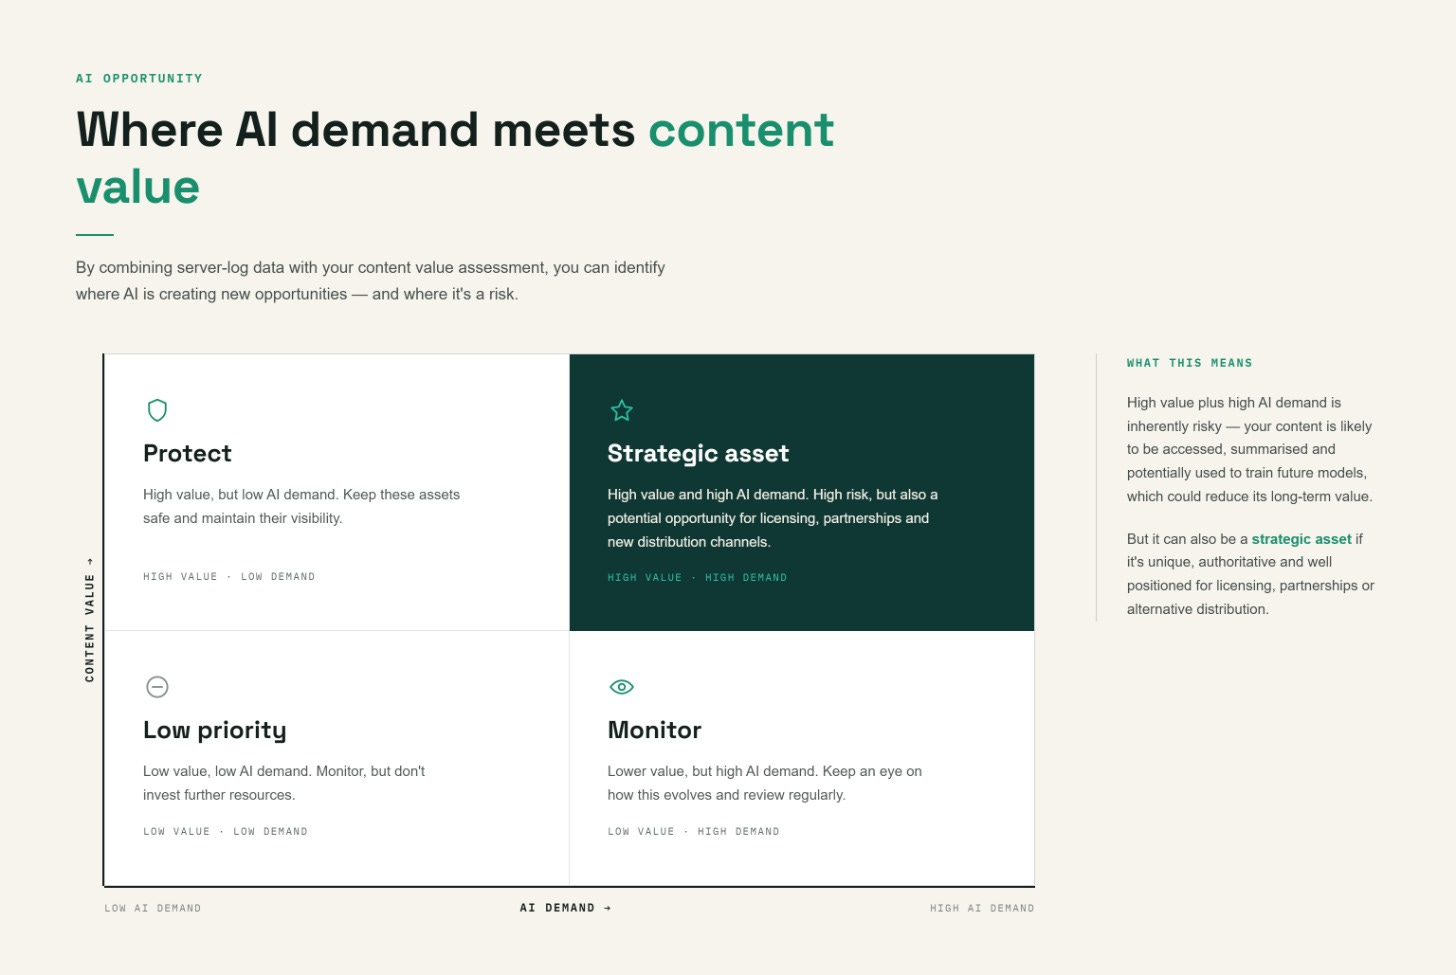
High-value proprietary content being hammered by retrieval crawlers could represent an opportunity, a liability, or both. But it’s something you’d probably want to know before making decisions about bot blocking, licensing, further investment, partnerships or AI distribution.
Crawler activity does not make content valuable. Nor does it mean an AI company will pay for it.
But combine AI demand with visibility, commercial value and content defensibility, and we have something, I think, genuinely useful. Something that says:
“Where is AI creating a threat to the existing business, and where could there be a new market for the value we already produce?”
We have to help companies understand the value of their content. As SEOs, we’re better placed than anyone to do that.
Allegedly at least. Anyway, ‘til next time!